This document outlines a method of extracting floodplains and terraces across the landscape based on thresholds of local gradient and elevation compared to the nearest channel. These thresholds are calculated statistically from the DEM using quantile-quantile plots, and do not need to be set manually by the user for the lansdcape in question. For more details on the methodology please refer to Clubb et al. (2017).
Floodplains are extracted across the whole DEM using thresholds of local gradient and relief relative to the nearest identified channel pixel. Terraces are extracted along a channel swath profile using an algorithm developed by Hergarten et al. (2014). The user needs to provide a CSV file with a pair of latitude and longitude coordinates. The code will extract the channel network between these coordinates and identify all terraces along this baseline channel.
1. The methodology
The method has several steps, which are outlined below:
-
The DEM is filtered using a Perona-Malik filter, a non-linear filter. For more details please refer to Perona and Malik (1990). This filter was chosen as it reduces micro-topographic noise while preserving sharp boundaries, such as between hillslopes and floodplains.
-
After filtering, the local slope and relief relative to the nearest channel are calculated for each pixel. To calculate the relief relative to the channel, a threshold stream order must be set to ensure that small first order tributaries are not selected. If identifying terraces, relief is calculated based on a swath profile rather than on the nearest channel.
-
Thresholds for slope and channel relief are calculated statistically from the DEM using quantile-quantile plots. This involves plotting the probability density function of each metric and calculating the deviation away from a reference normal distribution.
-
Any pixel with a value lower than both the channel relief and slope threshold is then classified as floodplain or terrace, giving a binary mask of 1 (floodplain/terrace) and 0 (not floodplain/terrace).
-
Floodplains and terraces are separated using a connected components algorithm (He et al. (2008)). Any patches which are connected to the channel network are identified as floodplain. The user can also specify a minimum height of the terraces above the modern channel. The connected components algorithm also assigns a unique ID to each floodplain/terrace.
-
The user can specify various topographic metrics to calculate for each patch of floodplain or terrace, such as elevation compared to the channel.
2. Get the code for floodplain and terrace extraction
The code for floodplain/terrace extraction can be found in our GitHub repository. This repository contains code for identifying floodplains based on relief relative to the nearest channel, and getting terraces along a channel swath profile.
2.1. Getting the code using LSDTopoToolsSetup.py
2.2. Clone the GitHub repository (not needed if you used LSDTopoToolsSetup.py)
If you haven’t run our vagrant setup, you need to clone the repository. First navigate to the folder where you will keep the GitHub repository. In this example it is called /LSDTopoTools/Git_projects/. To navigate to this folder in a UNIX terminal use the cd command:
$ cd /LSDTopoTools/Git_projects/You can use the command pwd to check you are in the right folder. Once you are in this folder, you can clone the repository from the GitHub website:
$ pwd
/LSDTopoTools/Git_projects/
$ git clone https://github.com/LSDtopotools/LSDTopoTools_FloodplainTerraceExtraction.git
2.3. Alternatively, get the zipped code
If you don’t want to use git, you can download a zipped version of the code:
$ pwd
/LSDTopoTools/Git_projects/
$ wget https://github.com/LSDtopotools/LSDTopoTools_FloodplainTerraceExtraction/archive/master.zip
$ gunzip master.zip
GitHub zips all repositories into a file called master.zip,
so if you previously downloaded a zipper repository this will overwrite it.
|
3. Preliminary steps
3.1. Getting the channel head file
Before the floodplain/terrace extraction algorithm can be run, you must create a channel network for your DEM. This can be done using the channel extration algorithms within LSDTopoTools. There are several channel extraction algorithms which you can choose from: for more details please refer to the channel extration section. Once you have run the channel extraction algorithm, you must make sure that the csv file with the channel head locations is placed in the same folder as your DEM.
If you are computing floodplains you might want a fancy channel extraction algorithm (like Driech or the Wiener method, see the channel extraction documentation), but for terraces you really are only going to need to pick up the big channels and you can get those with threshold drainage area. So you may with to save some time by extracting channels with this method for terrace studies.
3.2. Finding the correct window size
Before we can run the floodplain/terrace extraction algorithm, we need to calculate the correct window size for calculating slope across the DEM. This is used to calculate the thresholds for floodplain/terrace identification. Please refer to the selecting A window size section for information on how to calculate a window size for your DEM. We suggest a value of around 6 m for 1 m resolution DEMs, and a value of 15 m for 10 m resoluton DEMs.
4. Floodplains
This section explains how to extract floodplains across the DEM. We have provided some example datasets which you can use in order to test the floodplain extraction. If you are using the vagrant distribution, we recommend that you create a new directory in the Topographic_projects directory for each field site that you analyse. Navigate to the Topographic_projects directory using the cd command:
$ pwd
/LSDTopoTools/Git_projects/
$ cd ..
$ cd Topographic_projects/
In this tutorial we will work using a LiDAR dataset from Mid Bailey Run, Ohio. You should make a new directory for the Mid Bailey Run DEM in the Topographic_projects directory:
$ mkdir Mid_Bailey_Run/
$ cd Mid_Bailey_Run/
You can get the DEM for Mid Bailey Run from our ExampleTopoDatasets repository using wget:
$ wget https://github.com/LSDtopotools/ExampleTopoDatasets/raw/master/Bailey_DEM.bil
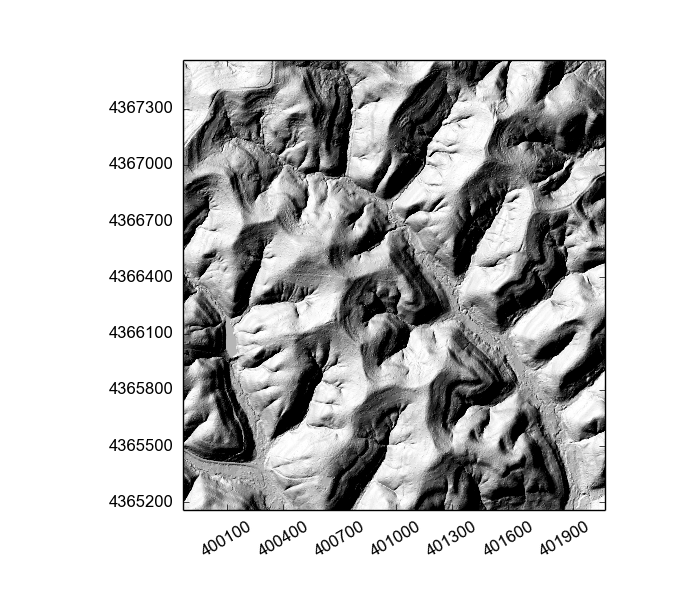
$ wget https://github.com/LSDtopotools/ExampleTopoDatasets/raw/master/Bailey_DEM.hdrThis dataset is already in the preferred format for use with LSDTopoTools (the ENVI bil format). The figure below shows a shaded relief map of part of the South Fork Eel River DEM which will be used in these examples.
4.1. Get the example parameter files
We have also provided some examples parameter files that are used to run the floodplain delineation. You can get the example floodplain driver using wget:
$ wget https://github.com/LSDtopotools/ExampleTopoDatasets/tree/master/example_parameter_files/ExampleFiles_FloodplainTerraceExtraction/LSDTT_floodplains.paramThis should be placed in the same folder as your DEM and the channel heads csv file. The example from Mid Bailey Run is called LSDTT_floodplains.param and should look like this:
# This is a driver file for LSDTopoTools
# Any lines with the # symbol in the first row will be ignored

# File information
dem read extension: bil
dem write extension: bil
read path: /LSDTopoTools/Topographic_projects/Mid_Bailey_Run/
read fname: Bailey_DEM
write fname: Bailey_DEM
CHeads_file: Bailey_DEM_Wsources

# Parameters for floodplain extraction
Filter topography: true
Min slope filling: 0.0001
surface_fitting_window_radius: 6
Threshold_SO: 3
Relief lower percentile: 25
Relief upper percentile: 75
Slope lower percentile: 25
Slope upper percentile: 75
QQ threshold: 0.005
Min patch size: 1000
You can run the analysis on the Mid Bailey Run DEM using the example parameter file, and modify it as you wish for your own DEM.
| You must make sure the description of the parameter in your file matches EXACTLY to the example, or the code will not recognise the parameter properly. If in doubt, check your spelling. |
The table below explains the function of each of these parameters:
| Parameter name | Data type | Description |
|---|---|---|
dem read extension |
String |
The file extension of your input DEM |
dem write extension |
String |
The file extension of the output rasters |
read path |
String |
The path to your DEM and parameter file |
read fname |
String |
The name of your DEM without extension |
CHeads_file |
String |
The name of the channel heads csv file without extension |
Filter topography |
Boolean |
Switch to run the filtering and filling of the DEM. Only set to false if you want to re-run the analysis (to save time). |
Min slope filling |
float |
Minimum slope for filling the DEM, suggested to be 0.0001 |
surface_fitting_window_radius |
float |
Window radius for calculating slope, should be calculated using the window size routines |
Threshold_SO |
integer |
Threshold Strahler stream order for the nearest channel. A value of 3 should work in most landscapes. |
Relief lower percentile |
integer |
Lower percentile for fitting Gaussian distribution to relief from quantile-quantile . Leave as 25 unless you have a weird quantile-quantile plot for the landscape. |
Relief upper percentile |
integer |
Upper percentile for fitting Gaussian distribution to relief from quantile-quantile plots. Leave as 75 unless you have a weird quantile-quantile plot for the landscape. |
Slope lower percentile |
integer |
Lower percentile for fitting Gaussian distribution to slope from quantile-quantile plots. Leave as 25 unless you have a weird quantile-quantile plot for the landscape. |
Slope upper percentile |
integer |
Upper percentile for fitting Gaussian distribution to rslope from quantile-quantile plots. Leave as 75 unless you have a weird quantile-quantile plot for the landscape. |
QQ threshold |
float |
Threshold for calculating difference between the real and Gaussian distributions from the quantile-quantile plots. Leave as 0.005 unless you have a weird quantile-quantile plot for the landscape. |
Min patch size |
integer |
Minimum number of pixels for each floodplain patch, can use to remove very small patches which may be due to noise. |
4.2. If you used LSDTopoToolsSetup.py
Navigate to driver_functions_Floodplains-Terraces directory in the folder LSDTopoTools_FloodplainTerraceExtraction:
$ cd /LSDTopoTools/Git_projects/LSDTopoTools_FloodplainTerraceExtraction/driver_functions_Floodplains-Terraces/You have already compiled the code, so you can just run the program with:
$ ./get_floodplains.out /path/to/DEM/location/ name_of_parameter_file.paramFor our example, the command would be:
$ ./get_floodplains.out /LSDTopoTools/Topographic_projects/Eel_River/ LSDTT_floodplains.param4.3. If you didn’t use LSDTopoToolsSetup.py
Before the code can be run, you must compile it. To do this you need to go to the driver_functions_Floodplains-Terraces directory in the folder LSDTopoTools_FloodplainTerraceExtraction. Navigate to the folder using the command:
$ cd /LSDTopoTools/Git_projects/LSDTopoTools_FloodplainTerraceExtraction/driver_functions_Floodplains-Terraces/and compile the code with:
$ make -f get_floodplains.makeThis may come up with some warnings, but should create the file get_floodplains.out. You can then run the program with:
$ ./get_floodplains.out /path/to/DEM/location/ name_of_parameter_file.paramFor our example, the command would be:
$ ./get_floodplains.out /LSDTopoTools/Topographic_projects/Eel_River/ LSDTT_floodplains.param4.4. Analysing the results
The program should take between 10 - 40 minutes to run, depending on the size of your DEM and your processing power. Once it is completed, you will have a number of bil files which you can open in a GIS of your choice. These files will include:
-
DEM_name_filtered.bil and .hdr: The original DEM after Perona-Malik filtering
-
DEM_name_channel_relief.bil and .hdr: A raster of elevations compared to the nearest channel
-
DEM_name_slope.bil and .hdr: A raster of local gradient
-
DEM_name_qq_relief.txt and _qq_slope.txt: Text files with the quantile-quantile plot information. This can be plotted in our python script to check whether the thresholds selected were appropriate.
-
DEM_name_FP.bil and .hdr: A raster of floodplain locations.
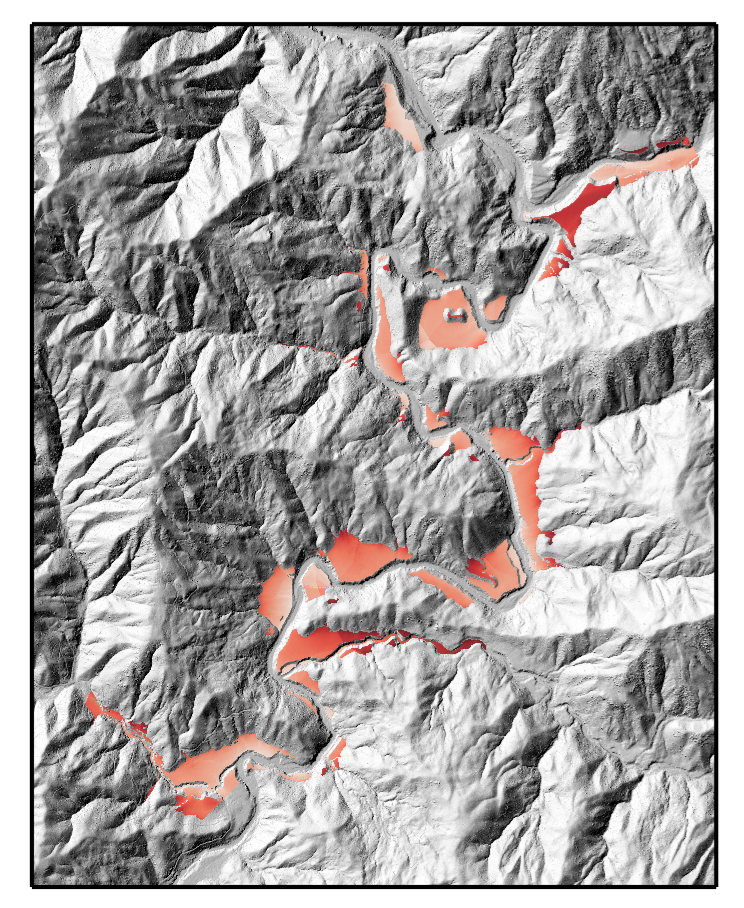
An example of the floodplains extracted from the Mid Bailey Run catchment is shown below. You should be able to get a raster similar to this by opening the file Bailey_DEM_FP.bil in a GIS of your choice.
5. Terraces
This section explains how to extract terraces along a channel by providing coordinates specifying the upstream and downstream extent of the channel.
| The terrace analysis, unlike the floodplain analysis, requires the point cloud library. See the introduction of this chapter or see these instructions for details: pcl installation instructions. |
We have provided some example datasets which you can use in order to test the terrace extraction. If you are using the vagrant distribution, we recommend that you create a new directory in the Topographic_projects directory for each field site that you analyse. Navigate to the Topographic_projects directory using the cd command:
$ pwd
/LSDTopoTools/Git_projects/
$ cd ..
$ cd Topographic_projects/
In this tutorial we will work using a LiDAR dataset from the South Fork Eel River, California. You should make a new directory for the Eel River DEM in the Topographic_projects directory:
$ mkdir Eel_River/
$ cd Eel_River/
You can get the DEM for the South Fork Eel River from our ExampleTopoDatasets repository using wget:
$ wget https://github.com/LSDtopotools/ExampleTopoDatasets/raw/master/Eel_River_DEM.bil
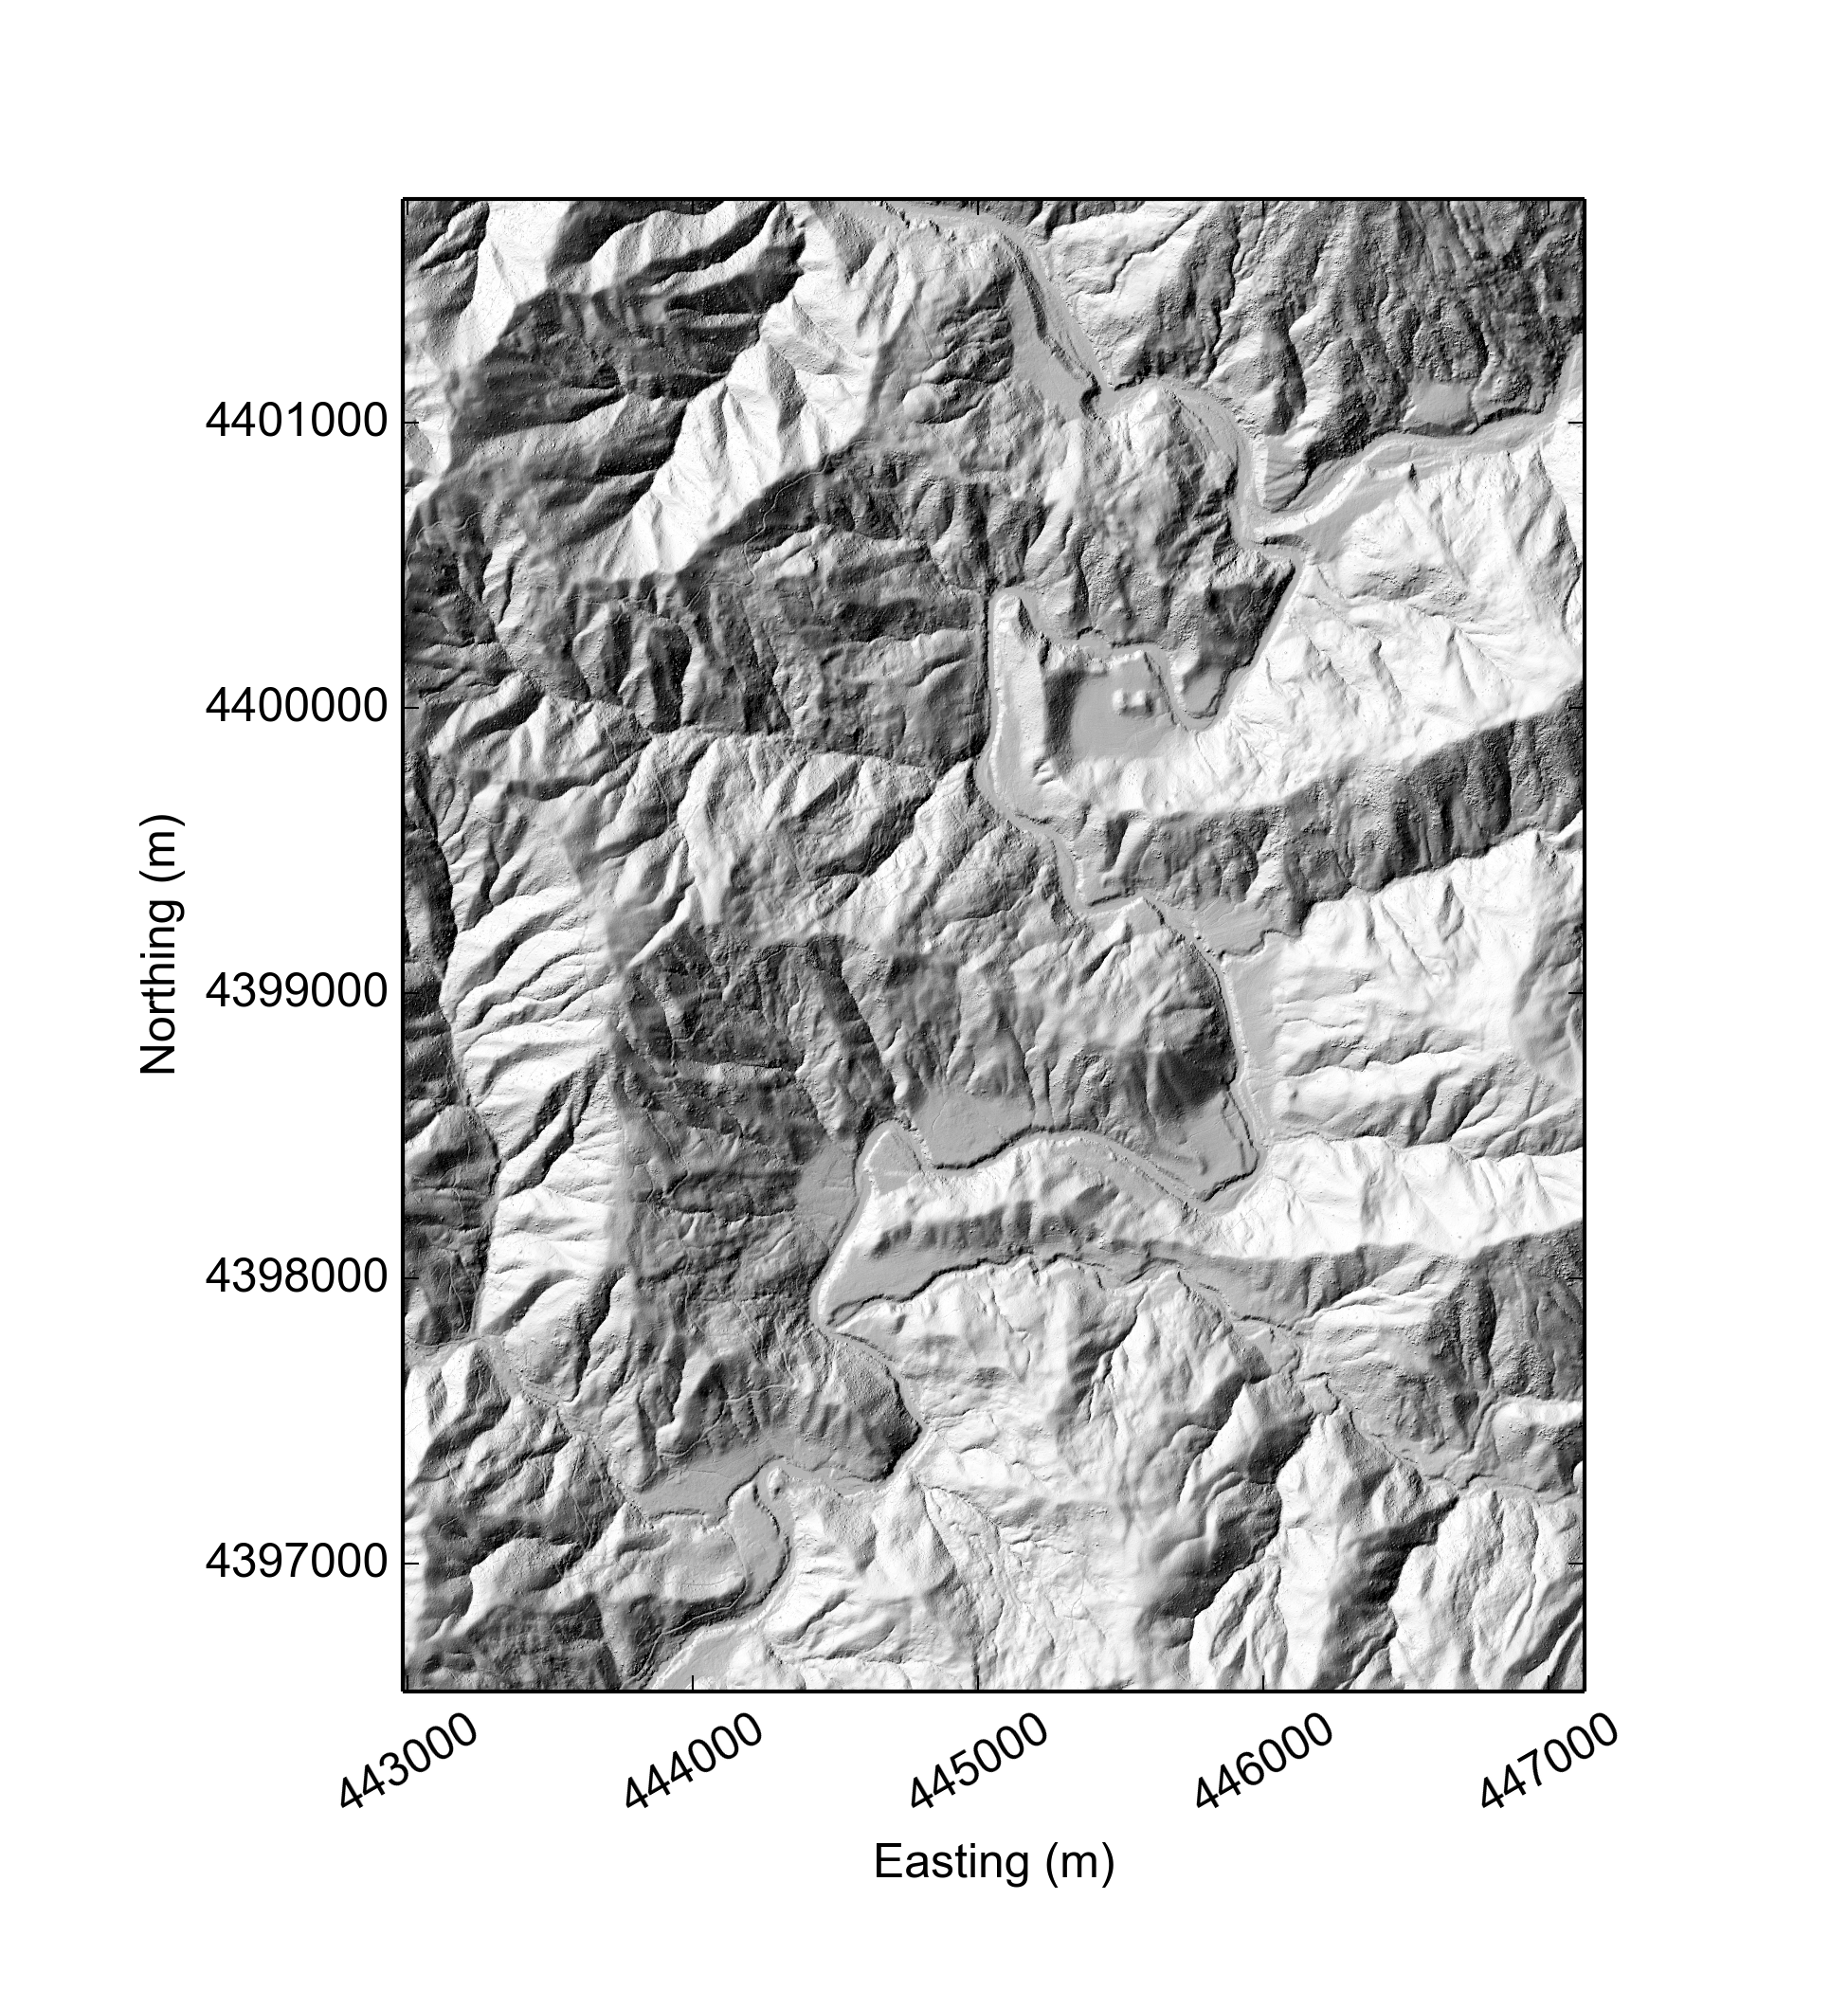
$ wget https://github.com/LSDtopotools/ExampleTopoDatasets/raw/master/Eel_River_DEM.hdrThis dataset is already in the preferred format for use with LSDTopoTools (the ENVI bil format). The figure below shows a shaded relief map of part of the South Fork Eel River DEM which will be used in these examples.
5.1. Get the example files
We have also provided two example files that are used to run the terrace extraction. The first is a parameter file that is used to run the code, and the second is a csv file with the latitude and longitude of two points on the Eel River. You can get the example files using wget:
$ wget https://github.com/LSDtopotools/ExampleTopoDatasets/tree/master/example_parameter_files/ExampleFiles_TerraceExtraction/LSDTT_terraces.param
$ wget https://github.com/LSDtopotools/ExampleTopoDatasets/tree/master/example_parameter_files/ExampleFiles_TerraceExtraction/Eel_River_DEM_coordinates.csv
Make sure that these files are stored in the same place as the DEM!! This should be in the folder /LSDTopoTools/Topographic_projects/Eel_River/
5.2. Get the channels
You need to run the channel extraction tool on the parameter file eel_area_threshold.driver. This will result in some channel network files, one of which will be a channel heads (or "sources") file: Eel_River_DEM_ATsources.csv.
5.3. Creating the parameter file
In order to run the terrace extraction code you must first create a parameter file for your DEM. If you have been following this tutorial, you should have downloaded an example parameter file for the Eel River DEM and placed this in the same folder as your DEM and the channel heads csv file. The example from the Eel River is called LSDTT_terraces.param and should look like this:
# This is a driver file for LSDTopoTools
# Any lines with the # symbol in the first row will be ignored

# File information
dem read extension: bil
dem write extension: bil
read path: /LSDTopoTools/Topographic_projects/Eel_River/
read fname: Eel_River_DEM
CHeads_file: Eel_River_DEM_ATsources
coords_csv_file: Eel_River_DEM_coordinates.csv

# Parameters for DEM processing
Filter topography: true
Min slope filling: 0.0001
surface_fitting_window_radius: 6

# Parameters for swath post-processing
HalfWidth: 1000
search_radius: 10
Threshold_SO: 3
NormaliseToBaseline: 1

# Pararmeters for terrace extraction
QQ threshold: 0.005
Relief lower percentile: 25
Relief upper percentile: 75
Slope lower percentile: 25
Slope upper percentile: 75
Min patch size: 1000
Min terrace height: 5
if you use a different channel extraction algorithm using the cannel extraction tool then the sources filename will differ. For example if you use a wiener method the channel heads filename will be Eel_River_DEM_Wsources.csv and the line on the parameter file for ingesting this data should be CHeads_file: Eel_River_DEM_Wsources.
|
You can run the analysis on the Eel River DEM using the example parameter file, and modify it as you wish for your own DEM.
| You must make sure the description of the parameter in your file matches EXACTLY to the example, or the code will not recognise the parameter properly. If in doubt, check your spelling. |
The table below explains the function of each of these parameters:
| Parameter name | Data type | Description |
|---|---|---|
dem read extension |
String |
The file extension of your input DEM |
dem write extension |
String |
The file extension of the output rasters |
read path |
String |
The path to your DEM and parameter file |
read fname |
String |
The name of your DEM without extension |
CHeads_file |
String |
The name of the channel heads csv file without extension |
coords_csv_file |
String |
The name of the csv file with the coordinates to extract the terraces (must end in .csv) |
Filter topography |
Boolean |
Switch to run the filtering and filling of the DEM. Only set to false if you want to re-run the analysis (to save time). |
Min slope filling |
float |
Minimum slope for filling the DEM, suggested to be 0.0001 |
surface_fitting_window_radius |
float |
Window radius for calculating slope, should be calculated using the window size routines |
HalfWidth |
integer |
Width of the swath profile in metres |
search_radius |
integer |
Number of pixels to search around input latitude/longitude coordinates for the nearest channel. |
Threshold_SO |
integer |
Threshold Strahler stream order for the baseline channel. A value of 3 should work in most landscapes. |
NormaliseToBaseline |
integer |
Switch to normalise the elevations to the nearest channel. For terrace extraction this should always be set to 1. |
QQ threshold |
float |
Threshold for calculating difference between the real and Gaussian distributions from the quantile-quantile plots. Leave as 0.005 unless you have a weird quantile-quantile plot for the landscape. |
Relief lower percentile |
integer |
Lower percentile for fitting Gaussian distribution to relief from quantile-quantile . Leave as 25 unless you have a weird quantile-quantile plot for the landscape. |
Relief upper percentile |
integer |
Upper percentile for fitting Gaussian distribution to relief from quantile-quantile plots. Leave as 75 unless you have a weird quantile-quantile plot for the landscape. |
Slope lower percentile |
integer |
Lower percentile for fitting Gaussian distribution to slope from quantile-quantile plots. Leave as 25 unless you have a weird quantile-quantile plot for the landscape. |
Slope upper percentile |
integer |
Upper percentile for fitting Gaussian distribution to rslope from quantile-quantile plots. Leave as 75 unless you have a weird quantile-quantile plot for the landscape. |
Min patch size |
integer |
Minimum number of pixels for each terrace, can use to remove very small patches which may be due to noise. |
Min terrace height |
integer |
Threshold height for terraces above the channel to separate from modern floodplain. |
5.4. Getting the latitude and longitude coordinates
To run the code, you need to provide a CSV file with two pairs of coordinates which specify the upstream and downstream points between which you want to find the terraces. The easiest way to do this is on Google Earth.
We have written the code so that it will take the coordinates in latitude and longitude and automatically convert them to the same UTM zone as the DEM - you don’t need to do this yourself! If you are following the tutorial for the Eel River site, then you should have downloaded the file Eel_River_DEM_coordinates.csv and placed this in the same folder as your DEM. For example, the Eel River file has the following structure:
Point_ID,latitude,longitude
1,39.722956,-123.650299
2,39.754546,-123.631409| The first point in the csv file must be the upstream point and the second point must be the downstream point. If this isn’t the case then the code will break! |
5.4.1. Debugging if the swath fails
If the swath fails, make sure the channel network extends near the points you have used for the swath starting and ending points. The channel extraction will generate a channel network raster, you can load this into your favourite GIS and also load the points: you will have to tell your GIS they are in WGS84 geographic projection (EPSG:4326) and make sure the points are close to channels.
| you will need a high number of significant digits in the lat-long coordinates. Do not let a spreadsheet program truncate the number of significant digits! |
5.5. If you used LSDTopoToolsSetup.py
Navigate to the folder driver_functions_Floodplains-Terraces directory in the folder LSDTopoTools_FloodplainTerraceExtraction:
$ cd /LSDTopoTools/Git_projects/LSDTopoTools_FloodplainTerraceExtraction/driver_functions_Floodplains-Terraces/You have already compiled the code, so you can just run the program with:
$ ./get_terraces.out /path/to/DEM/location/ name_of_parameter_file.paramFor our example, the command would be:
$ ./get_terraces.out /LSDTopoTools/Topographic_projects/Eel_River/ LSDTT_terraces.param5.6. If you didn’t use LSDTopoToolsSetup.py
Before the code can be run, you must compile it. To do this you need to go to the driver_functions_Floodplains-Terraces directory in the folder LSDTopoTools_FloodplainTerraceExtraction. Navigate to the folder using the command:
$ cd /LSDTopoTools/Git_projects/LSDTopoTools_FloodplainTerraceExtraction/driver_functions_Floodplains-Terraces/and compile the code with:
$ bash get_terraces.shThis may come up with some warnings, but should create the file get_terraces.out. You can then run the program with:
$ ./get_terraces.out /path/to/DEM/location/ name_of_parameter_file.paramFor our example, the command would be:
$ ./get_terraces.out /LSDTopoTools/Topographic_projects/Eel_River/ LSDTT_terraces.param5.7. Analysing the results
The program should take between 10 - 40 minutes to run, depending on the size of your DEM and your processing power. Once it is completed, you will have a number of bil files which you can open in a GIS of your choice. These files will include:
-
DEM_name_filtered.bil and .hdr: The original DEM after Perona-Malik filtering
-
DEM_name_UTM_check.csv: A csv file with the coordinates converted into UTM so you can check them in a GIS
-
DEM_name_swath_raster.bil and .hdr: A raster of elevations compared to the main channel in the shape of the swath profile
-
DEM_name_terrace_IDs.bil and .hdr: A raster of terrace locations with each terrace labelled with a unique ID
-
DEM_name_terrace_relief_final.bil and .hdr: A raster of terrace pixels labelled by elevation compared to the baseline channel.
-
DEM_name_terrace_swath_plots.txt: A text file with the information about the terraces compared to distance along the baseline channel that can be plotted using our Python script.
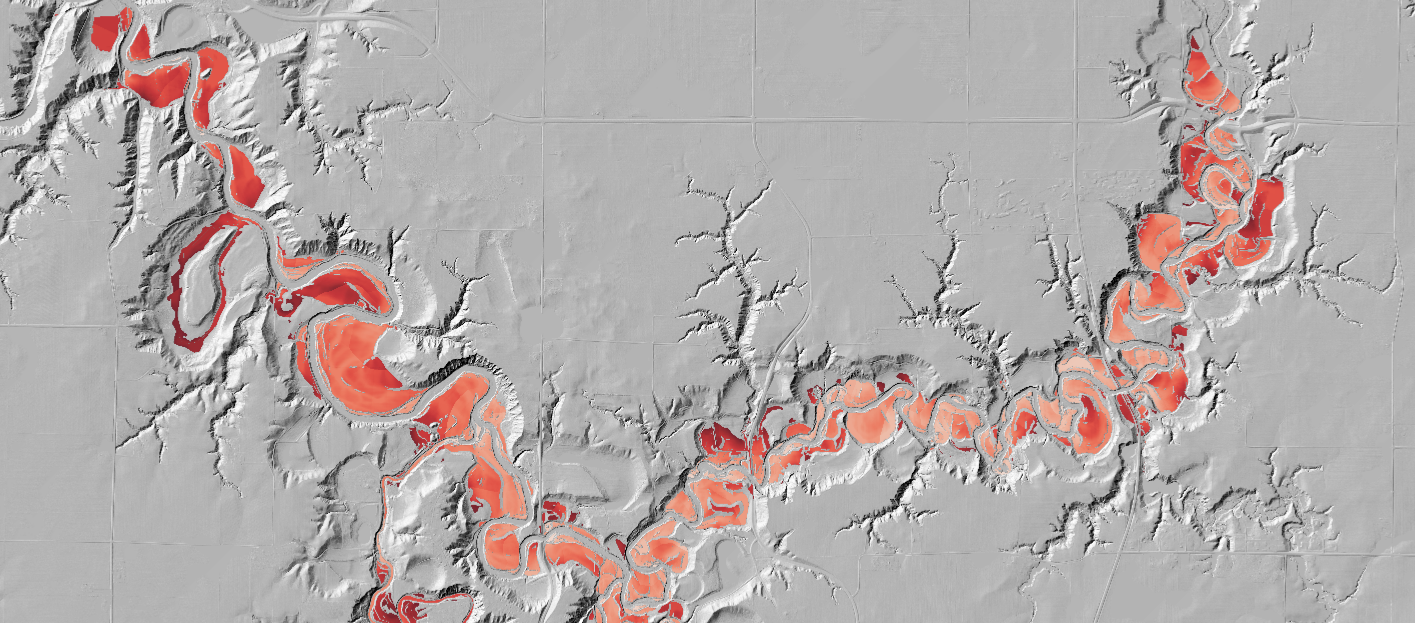
An example of the terraces extracted from the South Fork Eel River catchment is shown below. You should be able to get a raster similar to this by opening the file Eel_River_DEM_terrace_relief_final.bil in a GIS of your choice.